Heat Flow
|
|
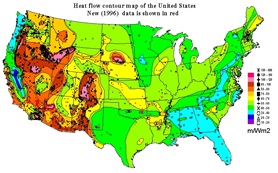
2004 Surface Heat Flow Map: Heat flow is determined by multiplying the well temperature gradient times the thermal conductivity. In developing the contour map, areas where few heat flow data are available the contours were both computer and hand determined to match the regional and topographic configuration. This is the U.S. portion of the Geothermal Map of North America, 2004. In this context the words geothermal and heat flow are synonymous. Ranges in heat flow on this map vary from 25 to 150 mW/m2. Note: mW = milliWatts and m = meters The Regional Heat Flow data base is a collection of published heat flow points prepared by David Blackwell et al. beginning in 1989 and continues to be updated. This work is completed for the Department of Energy (DOE). |
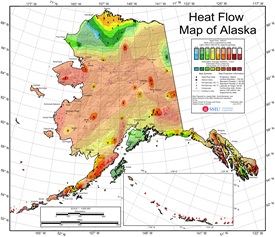 |
Alaska Surface Heat Flow (2013): This map is an update of the 2004 map by graduate student Joe Batir as part of his PhD research. Funding for data collection and analysis were from the Alaskan Energy Authority. |
|
|
1992 Surface Heat Flow Map: This map was part of the Geothermal Map of North America published in 1992 by the Geological Society of America (GSA) in conjunction with the GSA sponsored Decade of North American Geology (DNAG). Blackwell, D.D. and J.L. Steele, Geothermal Map of North America, Geol. Soc. Amer. DNAG Map No. 006, 1992. Blackwell, D.D., J.L. Steele and L.S. Carter, Heat flow patterns of the North American continent: A discussion of the DNAG geothermal map of North America, pp. 423-437, in D.B. Slemmons, E.R. Engdahl, and D.D. Blackwell eds., Neotectonics of North America, Geol. Soc. Amer. DNAG Decade Map Volume 1, pp. 498, 1991. |

|
Thermal Gradient: Conductivity divided into heat flow gives the mean thermal gradient. On a regional basis the gradient can vary from less than 15 to over 35°C/km. Within an individual well, gradients may vary up to 500% depending on the lithology, water flow through an aquifer or along a fault. |
|
|
Temperature at 4km Depth: Using the Regional Heat Flow Database information, an evaluation and assessment of the deeper resources in the United States was completed down to 4 km depths. The deepest hole measured in the United States is approximately 9100 meters, although most wells are under 3100 meters. To determine the Earth's internal temperature at any depth below the capabilities of normal well drilling, multiple data sets are synthesized. The data used for this figure are: thermal conductivity, thickness of sedimentary rock, geothermal gradient, heat flow and surface temperature. When sediments are less then 4 km deep, a constant basement thermal conductivity of 2.8W/m/K was used. The range of regional temperatures at 4 km is from less than 70 to over 150°C. |
|
|
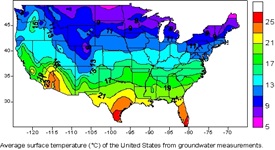
Average Ground Water Temperature Near Surface: This is a reproduction of the Map by T.E. Gass, in Geothermal Heat Pumps Geothermal Resources Council Bulletin 11(11), 3-8, 1982. |
|
|
Topography of United States: The ability to add topography to maps as a base layer used to be limited by computer speed and memory. In research projects today, overlaying interpreted data on to the detailed topography improves accuracy for the resource evaluation. Digital topography data is found [reference needed]. |

U.S. Regional Heat Flow Data Base: Detailed information on site location, well information, geology, and data, i.e., heat flow, temperature, temperature gradient, thermal conductivity, radioactive heat production, porosity, measurement comments, quality, etc. Not all sites contain information in each category. The data sets are saved using comma separated variables (*.csv) and can be easily brought into Microsoft Excel or any other spreadsheet program. There are usually three data files for each state or region. The first files were generated in 1989 for the data base creating the Decade of North America Geology (DNAG) Geothermal Map. The second set is from 1996 when the data base was officially updated for the Department of Energy. The third set is from 1999 when the Western U.S. High Temperature Geothermal data base was completed. As new data is received the files will continue to be updated. If you are aware of data that is missing or new data, please let Maria Richards know.
Related Publications:
Continental Heat Flow ( 3996kb pdf)
by Robert F. Roy, David D. Blackwell, and Edward R. Decker, in The Nature of the Solid Earth, Ed. E.C. Robertson, McGraw-Hill, New York, pp. 506-543, 1972.
Heat flow patterns of the North American continent: A discussion of the DNAG geothermal map of North America ( 115kb doc)
by Blackwell, D.D., J.L. Steele and L.S. Carter, in D.B. Slemmons, E.R. Engdahl, and D.D. Blackwell eds., Neotectonics of North America, Geol. Soc. Amer. DNAG Decade Map Volume 1, pp. 423-437, 1991.
Thermal Structure of the Continental Crust (606kb pdf)
by David D. Blackwell, in The Structure and Physical Properties of the Earth's Crust, Geophys. Mono. Ser. 14, ed. J.G. Heacock, 169-184, AGU, Washington D.C., 1971.
Heat Flow in the Northern Basin and Range Province (204kb pdf)